Customer service KPIs are important to ensure that your customers are happy. And why is that? Happy customers = Happy business!
It might sound obvious, but you’d be surprised how many companies forget this. Imagine you’re having trouble with something you bought. You call customer service, but nobody picks up, or you can’t find an answer online. Frustrated, right? That’s how customers feel when they don’t get good customer service. This is why we have curated for you a list of 30 important customer service KPIs to save the day!
Here’s the thing: unhappy customers easily become former customers. They’ll switch to competitors who treat them right. Before we begin with the detailed list of important customer service KPIs let’s jump into a survey taken to analyze what makes customers feel loyal to a brand, the following observations were made:
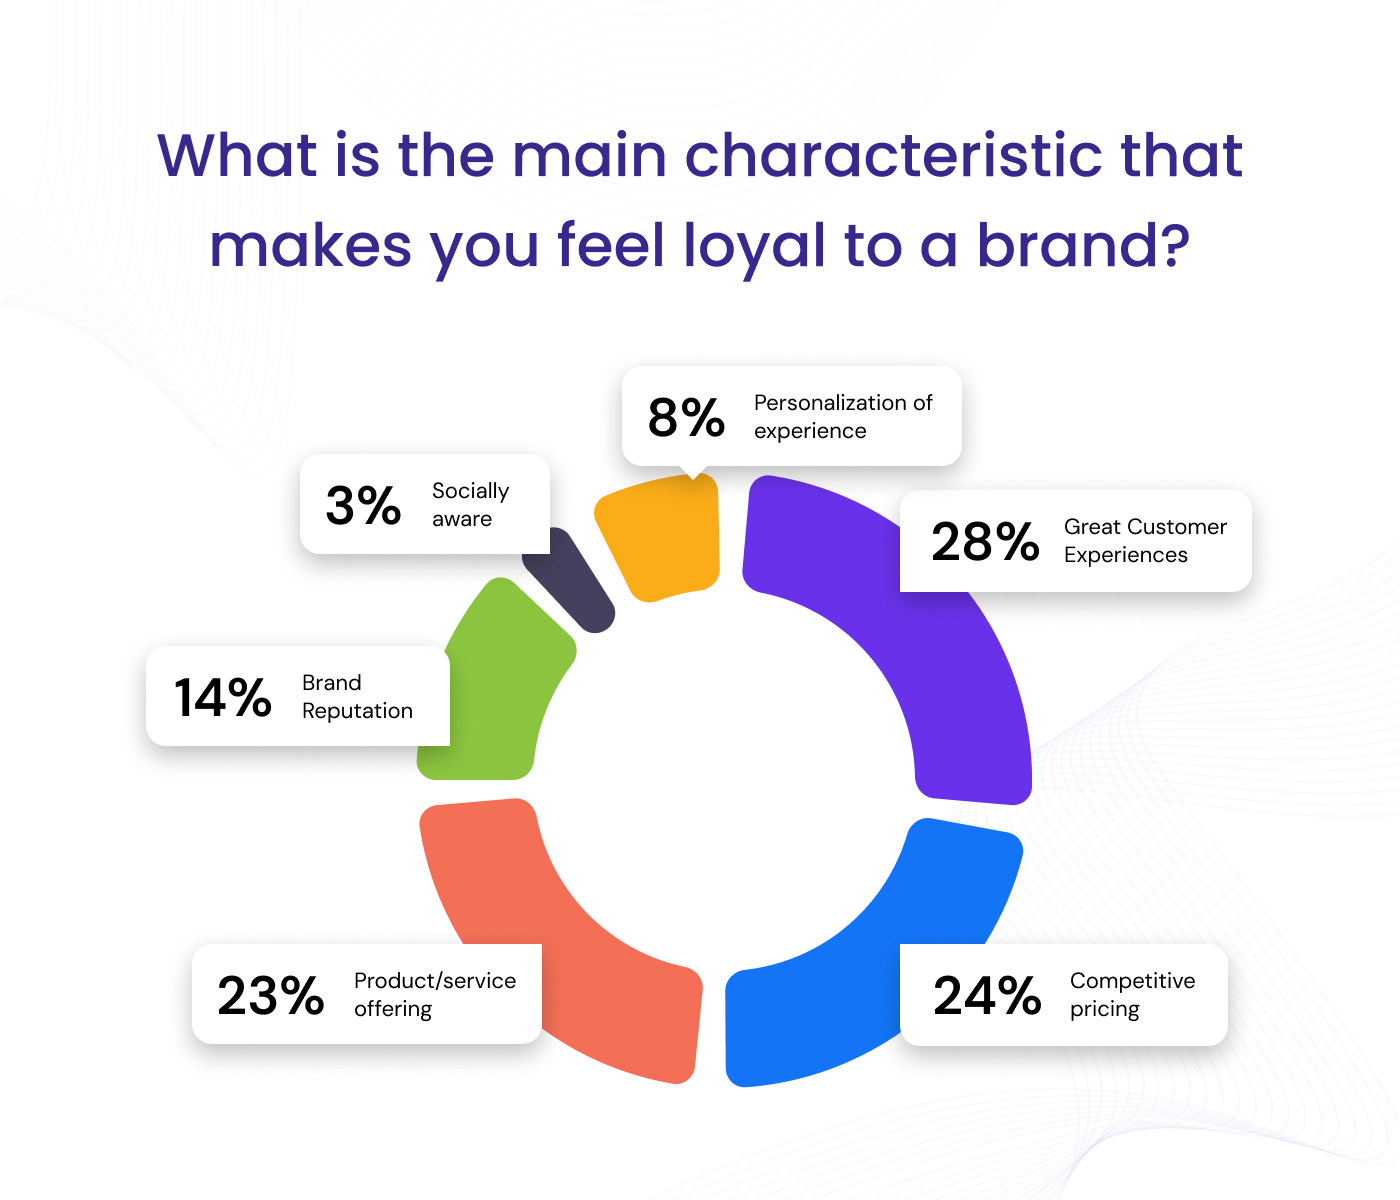
28% of the participants pointed out that great customer experiences were a key factor in them continuing their purchase or referring the provider to someone else.
This percentage overtook 24% which was for competitive pricing and 23% which was the product or service offered itself.
Stats credits: Verint State of CX Trends Report
Your customer service team is like the voice of your business. Having customer service KPIs is a dedicated effort to improving it in various ways that can lift your business. It can increase your monthly recurring revenue and decrease customer loss. Also, keeping an eye on how customers behave and recognizing patterns can be beneficial.
- What is SaaS Customer Service?
- Why Does SaaS Customer Support Matter?
- 30 Important SaaS Customer Service KPIs You Need
- Customer Satisfaction Score (CSAT)
- Customer Effort Score (CES)
- Net Promoter Score (NPS)
- First Contact Resolution (FCR)
- Average Resolution Time (ART)
- Average Handle Time (AHT)
- Number of Resolved Tickets
- First Response Time/ First Reply Time (FRT)
- Customer Churn Rate
- Customer Retention Rate
- Knowledge Base Views
- Customer Feedback
- Agent Feedback
- Escalation Rate
- Ticket Reopen Rate
- Number of Replies per Ticket
- Requester Wait Time
- Tickets Handled per Hour
- Tickets Solved per Hour
- Cost per Resolution
- Occupancy Rate
- Agent Productivity Rate
- Average Reply Time
- Knowledge Base Views
- Number of Tickets by Medium
- Abandon Rate
- Next Issue Avoidance (NIA)
- Consistent Resolutions
- Agent Touches per Ticket
- Monthly Recurring Revenue
- Conclusion
What is SaaS Customer Service?
And more importantly, how is it different from regular customer service?
For SaaS products, the vast segment of customer service narrows down. As you’re dealing with software, your support efforts will encompass tasks such as resolving technical issues, guiding customers through account setup, and addressing common queries. The main goal is to ensure customers not only use your product effectively but also derive maximum value from it.
Tips:
SaaS customer service team: Customers reach the agents for assistance with any kind of issues.
SaaS customer success team: Agents reach customers and help them to achieve their goals.
🎁 You May Also Like: Cloud Telephony Services: The Future of Customer Support
Why Does SaaS Customer Support Matter?
Customer loyalty hinges not just on product satisfaction but also on how they perceive your brand’s attention and respect towards them. A brand that appears indifferent or disrespectful, especially in assisting with its product, is viewed as lacking concern for customer satisfaction.
Astonishingly, approximately 68% of customers are inclined to leave if they sense a lack of care for their needs. On the flip side, customers are willing to pay roughly 25% more for a product accompanied by quality customer service, showcasing the substantial impact of customer service on sales, which is four times more influential than pricing.
The significance of having customer service KPIs to ensure quality customer service extends beyond immediate sales impact; it plays a pivotal role in reducing churn— the number of customers opting to cancel, pause, or downgrade their subscriptions post-purchase. Notably, customer service levels also wield influence over Monthly Recurring Revenue (MRR), a critical metric in SaaS customer support.
Retaining existing customers is a key strategy for increasing MRR, making excellent customer experience a linchpin in determining Customer Lifetime Value (CLTV), representing the total spending potential of a customer throughout their engagement with your business.
In essence, fostering customer loyalty, mitigating churn, boosting MRR, and enhancing CLTV are all interconnected outcomes of fulfilling exceptional customer service KPIs. This underscores the integral role that customer service KPIs play in shaping the overall success and sustainability of a business in the competitive landscape.
30 Important SaaS Customer Service KPIs You Need
Top KPIs to measure your Customer Satisfaction:
Customer Satisfaction Score (CSAT)
Ever wonder how companies measure how happy their customers are? It’s not just about smiling faces! One of the most effective customer service KPIs used by businesses in tracking their customer service is CSAT (Customer Satisfaction).
Think about it: when you buy something online or in person, sometimes you get a quick survey asking about your experience. Questions like “How satisfied were you with our customer service?” or “How likely are you to recommend us?” – that’s CSAT in action!

Customer Effort Score (CES)
Secondly, how much effort did the customer put into getting the solution? Do they feel like they had to jump through hoops to get help? Do they feel like your Knowledge Base is an old library full of dust and cobwebs? Or simply put, how much time did they invest in getting a resolution? CES (Customer Effort Score) is one of the customer service KPIs that measures just that!
Businesses use it to see how easy (or hard) it is for their customers to get their questions answered and issues resolved. Remember, smooth sailing leads to happy customers!

Net Promoter Score (NPS)
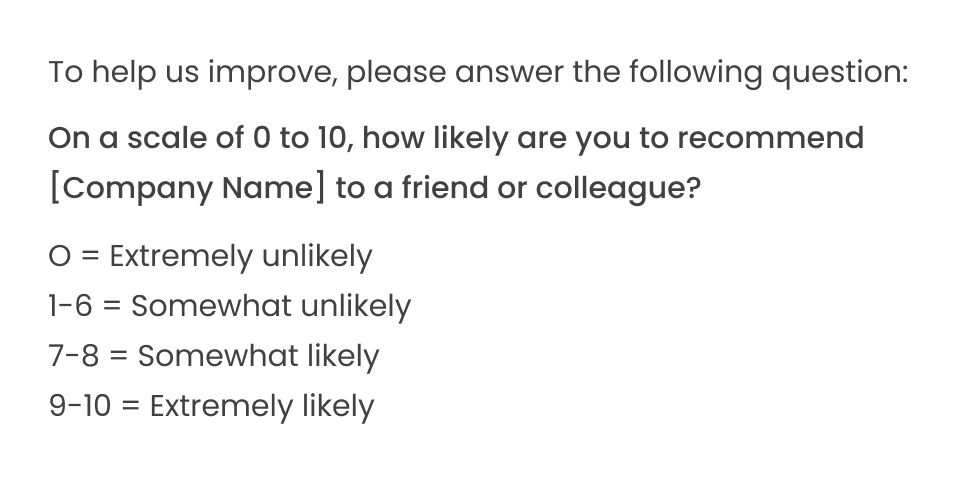
This customer service KPI is comparable to a Customer Satisfaction (CSAT) survey. You might have frequently encountered companies requesting you to respond to a straightforward question akin to the example above. The purpose is to assess, on a scale from 1 to 10, how likely you are to recommend the company’s product or services to a friend. This serves as a direct indicator of the percentage of customer loyalty.
Top customer service KPIs to measure your Customer Experience:
First Contact Resolution (FCR)
The First Contact Resolution rate is a metric that is often used to evaluate the efficiency of your customer service process. It is the percentage of customer tickets that the agents could resolve on the first interaction with a customer without transferring it to other agents.

Average Resolution Time (ART)
How long does it take the company to solve a client problem?
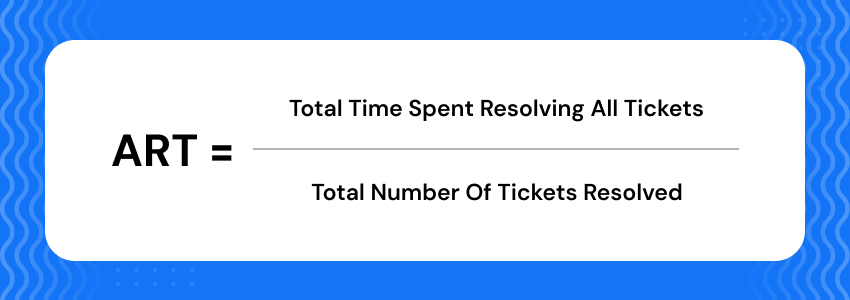
The Average Resolution Time is a customer service KPI that measures the average time it takes the customer service agents to resolve a support ticket from the moment the customer raises it. Imagine dividing the total time spent solving all tickets during a specific period (like an eight-hour shift) by the number of tickets solved. That’s the average resolution time! This helps companies understand how quickly they can help customers and check if there’s room for improvement.
Average Handle Time (AHT)
In inbound call situations, knowing how long calls take is crucial. We use a customer service KPI called Average Handle Time (AHT) to understand this. It considers the entire interaction, from the moment a customer calls to any follow-up after the call, like surveys or agent notes. This helps us see how efficient our calls are and if we can make things smoother for you.
Additionally, a good customer support system should keep track of one another customer service KPI, Average Speed to Answer (ASA). This tells us how long it typically takes our team to pick up your call, ensuring you don’t wait too long for help!

Number of Resolved Tickets
Keeping track of the total number of customer service tickets resolved within a specific period, like a day, week, or month, is another important customer service KPIs. This metric helps companies see how productive the individual agents and their entire team are in tackling customer issues.
It’s like keeping score in a game, but the goal is to help as many customers as possible! This information allows us to see if everyone has the resources they need to succeed and ensures we’re meeting your support needs effectively.
First Response Time/ First Reply Time (FRT)
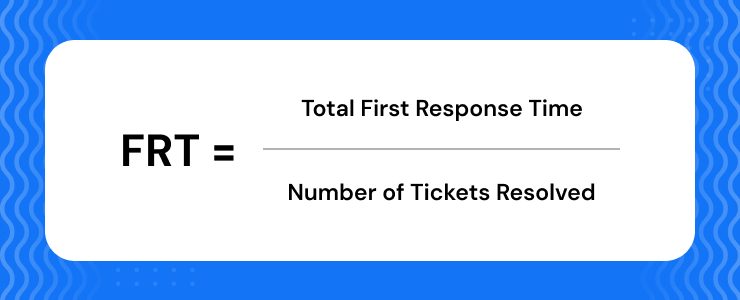
A First Response Time or a First Reply Time is the average time taken for the customer service agents to first reply to a customer message. This customer service KPI helps to learn how well agents can handle multiple tickets simultaneously, and how well they can manage their time during times of excess incoming tickets.
The lower the FRT, the quicker the customer service agents are helping the customers who need assistance. This customer service KPI is calculated by adding the time all agents take to respond to tickets and then dividing it by the total number of tickets.
For example, if three agents take 60, 50, and 40 seconds to respond to three tickets, the average would be (60+50+40) / 3 = 50 seconds.
Customer Churn Rate
On the flip side, there’s another customer service KPI, the Customer Churn Rate. It is a significant metric extensively employed by SaaS companies. Churn occurs when customers decide to cancel their SaaS subscriptions, essentially “churning out.” Failure to meet customer needs or provide exceptional customer service (as “good” support may not suffice to distinguish you anymore) is likely to contribute to an increase in your churn rate.

Customer Retention Rate
Customer retention is a pivotal metric given in subscription-based model customer service KPIs. Hinging on customers making consistent monthly or annual payments. The Customer Retention Rate (CRR) precisely measures the number of customers that a SaaS company successfully retains over a designated period.

Credits: Customer Thermometer
Top customer service KPIs to measure your Customer Engagement:
Knowledge Base Views
Instead of relying just on agents, we offer a self-service knowledge base with everything you need to know about our software, from updates to FAQs and troubleshooting guides.
Tracking the number of visits to our knowledge base helps us in a few ways:
- Identify common issues: By seeing which articles are most popular, we can understand what challenges users face the most.
- Spot trends: Sudden spikes in specific topic searches might indicate new issues or areas where our documentation needs improvement.
- Improve clarity: If a particular article has a lot of views but doesn’t seem to be solving problems, we know it needs to be clearer or more helpful.
This information allows us to constantly improve our knowledge base, empowering you to solve problems independently and reducing the need for direct assistance.
Customer Feedback
Another of the customer service KPIs would be gathering number-based or sentiment-based customer feedback through various channels is important. A company with its doors open at multiple channels like emails, phones, SMS broadcasting, WhatsApp, and various social media needs to track the efficiency of teams handling these endpoints.
Customer feedback analysis provides important information like a fall in efficiency at any one of these points. This customer service KPI ensures delivery and insights for the performance of both teams and individuals in the department. This also helps to adopt a successful strategy or approach to customer tickets from one of these sources to all others if possible.

Agent Feedback
Empowering your agents through feedback is crucial for company success. By gathering quantitative and qualitative data through surveys, you can gain valuable insights into their experiences and suggestions. This customer service KPI allows you to identify areas for improvement in the customer support process and escalation strategy.
Remember, your agents are at the forefront of customer service, encountering diverse situations daily. Harnessing their expertise through feedback can lead to effective solutions and improved customer service practices.
Escalation Rate
You might have often come across issues that require transferring to a “supervisor” or someone with “more experience” during customer service. That’s an escalation! In the world of customer service KPIs, the escalation rate tracks how often this happens. It’s a percentage showing how many support tickets needed additional help from a specialist.
Why does this matter? Well, a high escalation rate can reveal a few things. It might mean your frontline support team needs more training or resources to handle specific situations. It could also hint at gaps in your knowledge base or self-service options, leaving customers needing further assistance. By keeping an eye on this customer service KPI, you can identify areas where your customer service can be even better, leading to happier customers and fewer frustrations in the long run!

Ticket Reopen Rate
Ever seen a customer reaching out a second time with the same situation? Yes, you might have considered their ticket to be closed but there might have been a lack of clarity in the solution or maybe it was not communicated effectively. This is what a “ticket reopen” signifies in customer service KPIs.
Ticket Reopen Rate refers to the number of times a previously closed support ticket needs to be reopened by an agent.
So, why should you care about ticket reopens? A high rate can be a red flag for several reasons. It might suggest the initial resolution wasn’t effective, leaving the customer with the same problem. It could also point to unclear communication or insufficient information provided during the first interaction.
By keeping an eye on your ticket reopen rate, you can identify areas where your customer service process needs improvement, ultimately leading to more satisfied customers and fewer headaches down the line.

Number of Replies per Ticket
Picture a conversation with a friend: the shorter and to the point, the more efficient it is, right? That’s similar to the concept of “Average Replies per Ticket” in customer service KPIs. This metric tracks how many back-and-forth messages occur between a customer and an agent before an issue is resolved.
You can calculate this by taking the average number of responses exchanged between the two per ticket.
But why is this important? If the replies per ticket are few, it indicates a knowledgeable and efficient customer service team who can address customer concerns accurately and swiftly. But sometimes when the queries necessitate more communication, a consistently high average number of replies per ticket could highlight areas for improvement. This could include knowledge base gaps or agent training requirements.
By keeping an eye on this metric, you can ensure your team is equipped to resolve customer issues quickly and effectively, leading to a more positive experience for everyone involved.
Requester Wait Time
The waiting game is an undesirable one, for the customers as well as the customer service providers. Due to the lack of various factors, your customers can be put in long waiting lines. This is what “requester wait time” means in customer service KPIs. It tracks the total time a customer spends waiting for an agent’s response after submitting a support ticket, including when the ticket is new, open, or on hold.
Long wait times can lead to frustrated customers and negatively impact their experience. By monitoring this customer service KPI, you can assess the effectiveness of your response times and identify areas for improvement. This can involve streamlining processes, optimizing staffing levels, or implementing solutions like chatbots, IVR systems, etc., to address simpler inquiries faster. Ultimately, keeping wait times low demonstrates respect for your customers’ time and leads to a more positive customer experience.
Top customer service KPIs to measure your Efficiency and Cost:
Tickets Handled per Hour
Tickets Handled per Hour is a customer service KPI that helps you measure the effectiveness of your customer service team.
Imagine you submit a support ticket and it lands on a specific agent’s desk. This customer service KPI simply tracks the number of tickets that the agent interacts with (opens, reads, responds, etc.) within an hour. It helps us understand how well our agents can juggle multiple inquiries, prioritize tasks, and keep things moving smoothly.
This doesn’t mean the higher the number, the better. We don’t want our agents rushing through interactions just to meet a quota. Instead, we use this data in conjunction with other factors like customer satisfaction ratings to get a complete picture of their performance. By analyzing this, we can identify areas for improvement and provide targeted support to help our agents become even more efficient and effective in resolving your concerns.
Tickets Solved per Hour
This customer service KPI can be defined as the number of tickets an agent fully resolves (investigates, provides a solution, closes the ticket) within a specific timeframe, typically an hour. It allows us to understand an agent’s problem-solving abilities and identify potential areas where they might need support.
By analyzing both “tickets handled” and “tickets solved” per hour, we can gain valuable insights into an agent’s overall workflow, efficiency, and problem-solving skills.
This data allows us to provide targeted training, support, and resources to help our team become even more effective in resolving your concerns quickly and efficiently while maintaining high-quality customer service.
Cost per Resolution
Cost per Resolution is a customer service KPI that measures the total cost of running a customer service that is, including employee salaries, equipment charges, communication charges, etc, divided by the number of tickets resolved by the team in a specific period. This customer service KPI is calculated to help understand the average cost of addressing a customer’s concerns.
CPR helps the company to make informed decisions about staffing, resource allocation, and overall service efficiency. This helps the company think intelligently while reducing costs while consistently improving their customer service.

Occupancy Rate
The customer service team is not always waiting at the other end looking at their phone eagerly waiting for it to ring. They efficiently utilize the time when they are not handling calls in other productive tasks. Occupancy is a customer service KPI used to calculate the time spent by an individual customer service representative.
This metric helps managers analyze whether their agents are:
- Busy involved in customer communication via calls
- Busy involved in customer queries via chat
- Working on ticket backlogs
- Or too busy to properly attend to calls without drops

Agent Productivity Rate
The sole purpose of the customer service team is to resolve customer tickets. Therefore it becomes important to measure this customer service KPI. No matter what tasks they complete, their ultimate goal is to utilize the time they are working to resolve tickets.

Top customer service KPIs to measure your Employee Satisfaction:
Average Reply Time
The average reply time is a customer service KPI that measures how long it takes agents to respond to customer queries across all marketing communication with a customer, not just how long it takes to respond to initial outreach. For example, the amount of time it takes the agent to respond to each chat message sent by a customer.
Knowledge Base Views
Knowledge base views have nothing to do with customer interaction with an agent. But this customer service KPI measures the number of page views on FAQ or support pages. It enables companies to identify trends in customer issues based on the volume of their searches.
Top customer service KPIs to measure your Additional Measures:
Number of Tickets by Medium
This customer service KPI is used to categorize the number of tickets that are raised by customers over various sources or mediums. It can be calls, emails, social media marketing, SMS, web chat, etc.
This helps to give the team manager an understanding of the patterns and trends in customer queries and the efficiency of the teams by analyzing their closure and reopening rates.
Abandon Rate
Abandon rate is a metric specially reserved for call center software operations like customer service via phone calls. It is the number of calls that got abandoned by the customer before speaking to an agent.
The equation that allows you to calculate this customer service KPI is:

Credits: Call Center KPI benchmarks
Next Issue Avoidance (NIA)
Avoid the “Wait, I Already Asked This!” Moment. Imagine contacting customer service only to find yourself back in their queue later with the same issue. Oops! That’s not healthy. To prevent this awkward moment, we can track a metric called Next Issue Avoidance (NIA).
NIA measures how often customers are opening multiple tickets for the same problem. Ideally, the team should complete a ticket in its first incidence. This is where NIA as a customer service KPI comes into play. Having a high NIA shows that the effectiveness of the support process is weak.
The NIA often goes hand in hand with another metric: First Contact Resolution (FCR). If both numbers are low, it denotes that there must be a significant improvement in the support process.
Consistent Resolutions
Your agents may come from different backgrounds and might have different manners of resolving an issue. But, they all must follow a standard procedure and response to resolve one particular situation.
Consistent resolutions are a customer service KPI that every business should follow so that resolutions to tickets that come from different sources must be the same everywhere, every time.
Agent Touches per Ticket
The number of times an agent touches or interacts with a ticket is crucial. Mostly it is not recommended that you touch a ticket unnecessarily without having any solid reason to do so. But, sometimes a ticket must be touched for an update regarding a pending resolution so that the customer does not feel ghosted. The number of touches on a ticket can mean any of these:
- Responding to the customer or commenting on a ticket
- Updating a customer or a team member
- Reassigning, transferring, reopening, or closing a ticket
Congratulations! If you have read till here we are sure that you mean business! Here is the last one we promised you:
Monthly Recurring Revenue
Monthly Recurring Revenue (MRR), is your final customer service KPI. This term has been a constant presence since I began my career in SaaS companies. The MRR is a significant indicator of customer satisfaction. Satisfied customers are more likely to maintain their subscriptions, contributing to a steady stream of monthly or yearly payments. The higher the number of subscribers you attract, the more MRR (and its annual and counterpart, ARR – Annual Recurring Revenue) you generate.

Conclusion
Customer service KPIs aren’t just about fixing problems, it’s about nurturing relationships and building a loyal customer base. But how do you know if your efforts are paying off? That’s where Customer Service KPIs come in.
Think of them as scorecards for your customer experience (CX) team. These key performance indicators help you track, analyze, and improve your service in crucial areas, like customer satisfaction, agent performance, and first contact resolution. These metrics provide valuable insights into how effectively your team is resolving issues, keeping customers happy, and ensuring a positive experience for everyone.
However, keeping track of all these metrics can be overwhelming. That’s where Office24by7 as a reliable CX partner comes in.
Streamline the process and maximize the impact of your efforts. Office24by7 offers powerful tools and resources to empower your team, gain valuable insights from data, and ensure seamless customer interactions across all touchpoints. Some of their products include Task Management and Ticket Management systems. By focusing on a dedicated CX strategy and partnering with the right tools and expertise, you can unlock the power of meaningful customer connections and elevate your overall customer experience.
Try us out for free today!


